
Appearance
Relationships: gateway products, affinity and purchase sequences
Relationships shows how your products connect through customer behavior. It shows which first purchase leads to more orders, which products sell together, and what customers buy before and after a product. To open it, go to Insights > Products > Relationships.
Problem and intended user
The ecommerce manager (the person who runs the store) needs to know which products to feature, bundle and cross-sell. The media buyer (the person who runs your paid ads) needs to know which products win new customers. Both need to know which first purchase brings a customer back. Without that, ad budget can go to products that never lead to a second order.
Current workflow
Without Nexus, you export orders from Shopify admin reports and join them in a spreadsheet. You group orders by customer, find each customer's first product, then count who ordered again. You count how often two products share an order the same way. Some stores ask an agency to build this view.
Prerequisites
- Your order history must be imported. Until it is, the tab tells you what it will show once the import ends.
- Your store needs repeat buyers. Few repeat buyers means little to show.
- A product needs at least 30 first-time buyers to be flagged as a gateway.
How Nexus works
Nexus reads your order history and applies fixed rules. No AI writes these results. Nexus does not re-import from Shopify to compute them. Nexus does not change your product scores. No step needs an approval. Results depend on the order import.
A gateway product is a first purchase that leads to more orders. The Gateway Score is a score from 0 to 100 that blends three inputs:
- The second-purchase rate. This input counts most.
- The average predicted revenue of first-time buyers.
- How many other products it sells with.
Nexus flags a product as a gateway when its score reaches the current threshold. Fee and service lines, such as set-up fees or shipping protection, are never gateway products.
Switch between the three views
A switch at the top of the tab has three buttons: Gateway Products, Affinity Network and Purchase Sequences. A line of help text under the switch explains the active view.
Refresh the results
Nexus refreshes Relationships on its own about once a week. The info icon next to Compute Relationships says so. You do not need to act. The Product relationships row on Store Status shows when Nexus last ran it. Orders import on their own, and Compute Relationships starts the analysis.
To refresh now, select Compute Relationships. This is useful after a large order import. The button reads Computing… while it works. When it ends, the tables reload. Results are replaced in place.
Work with the Affinity Network
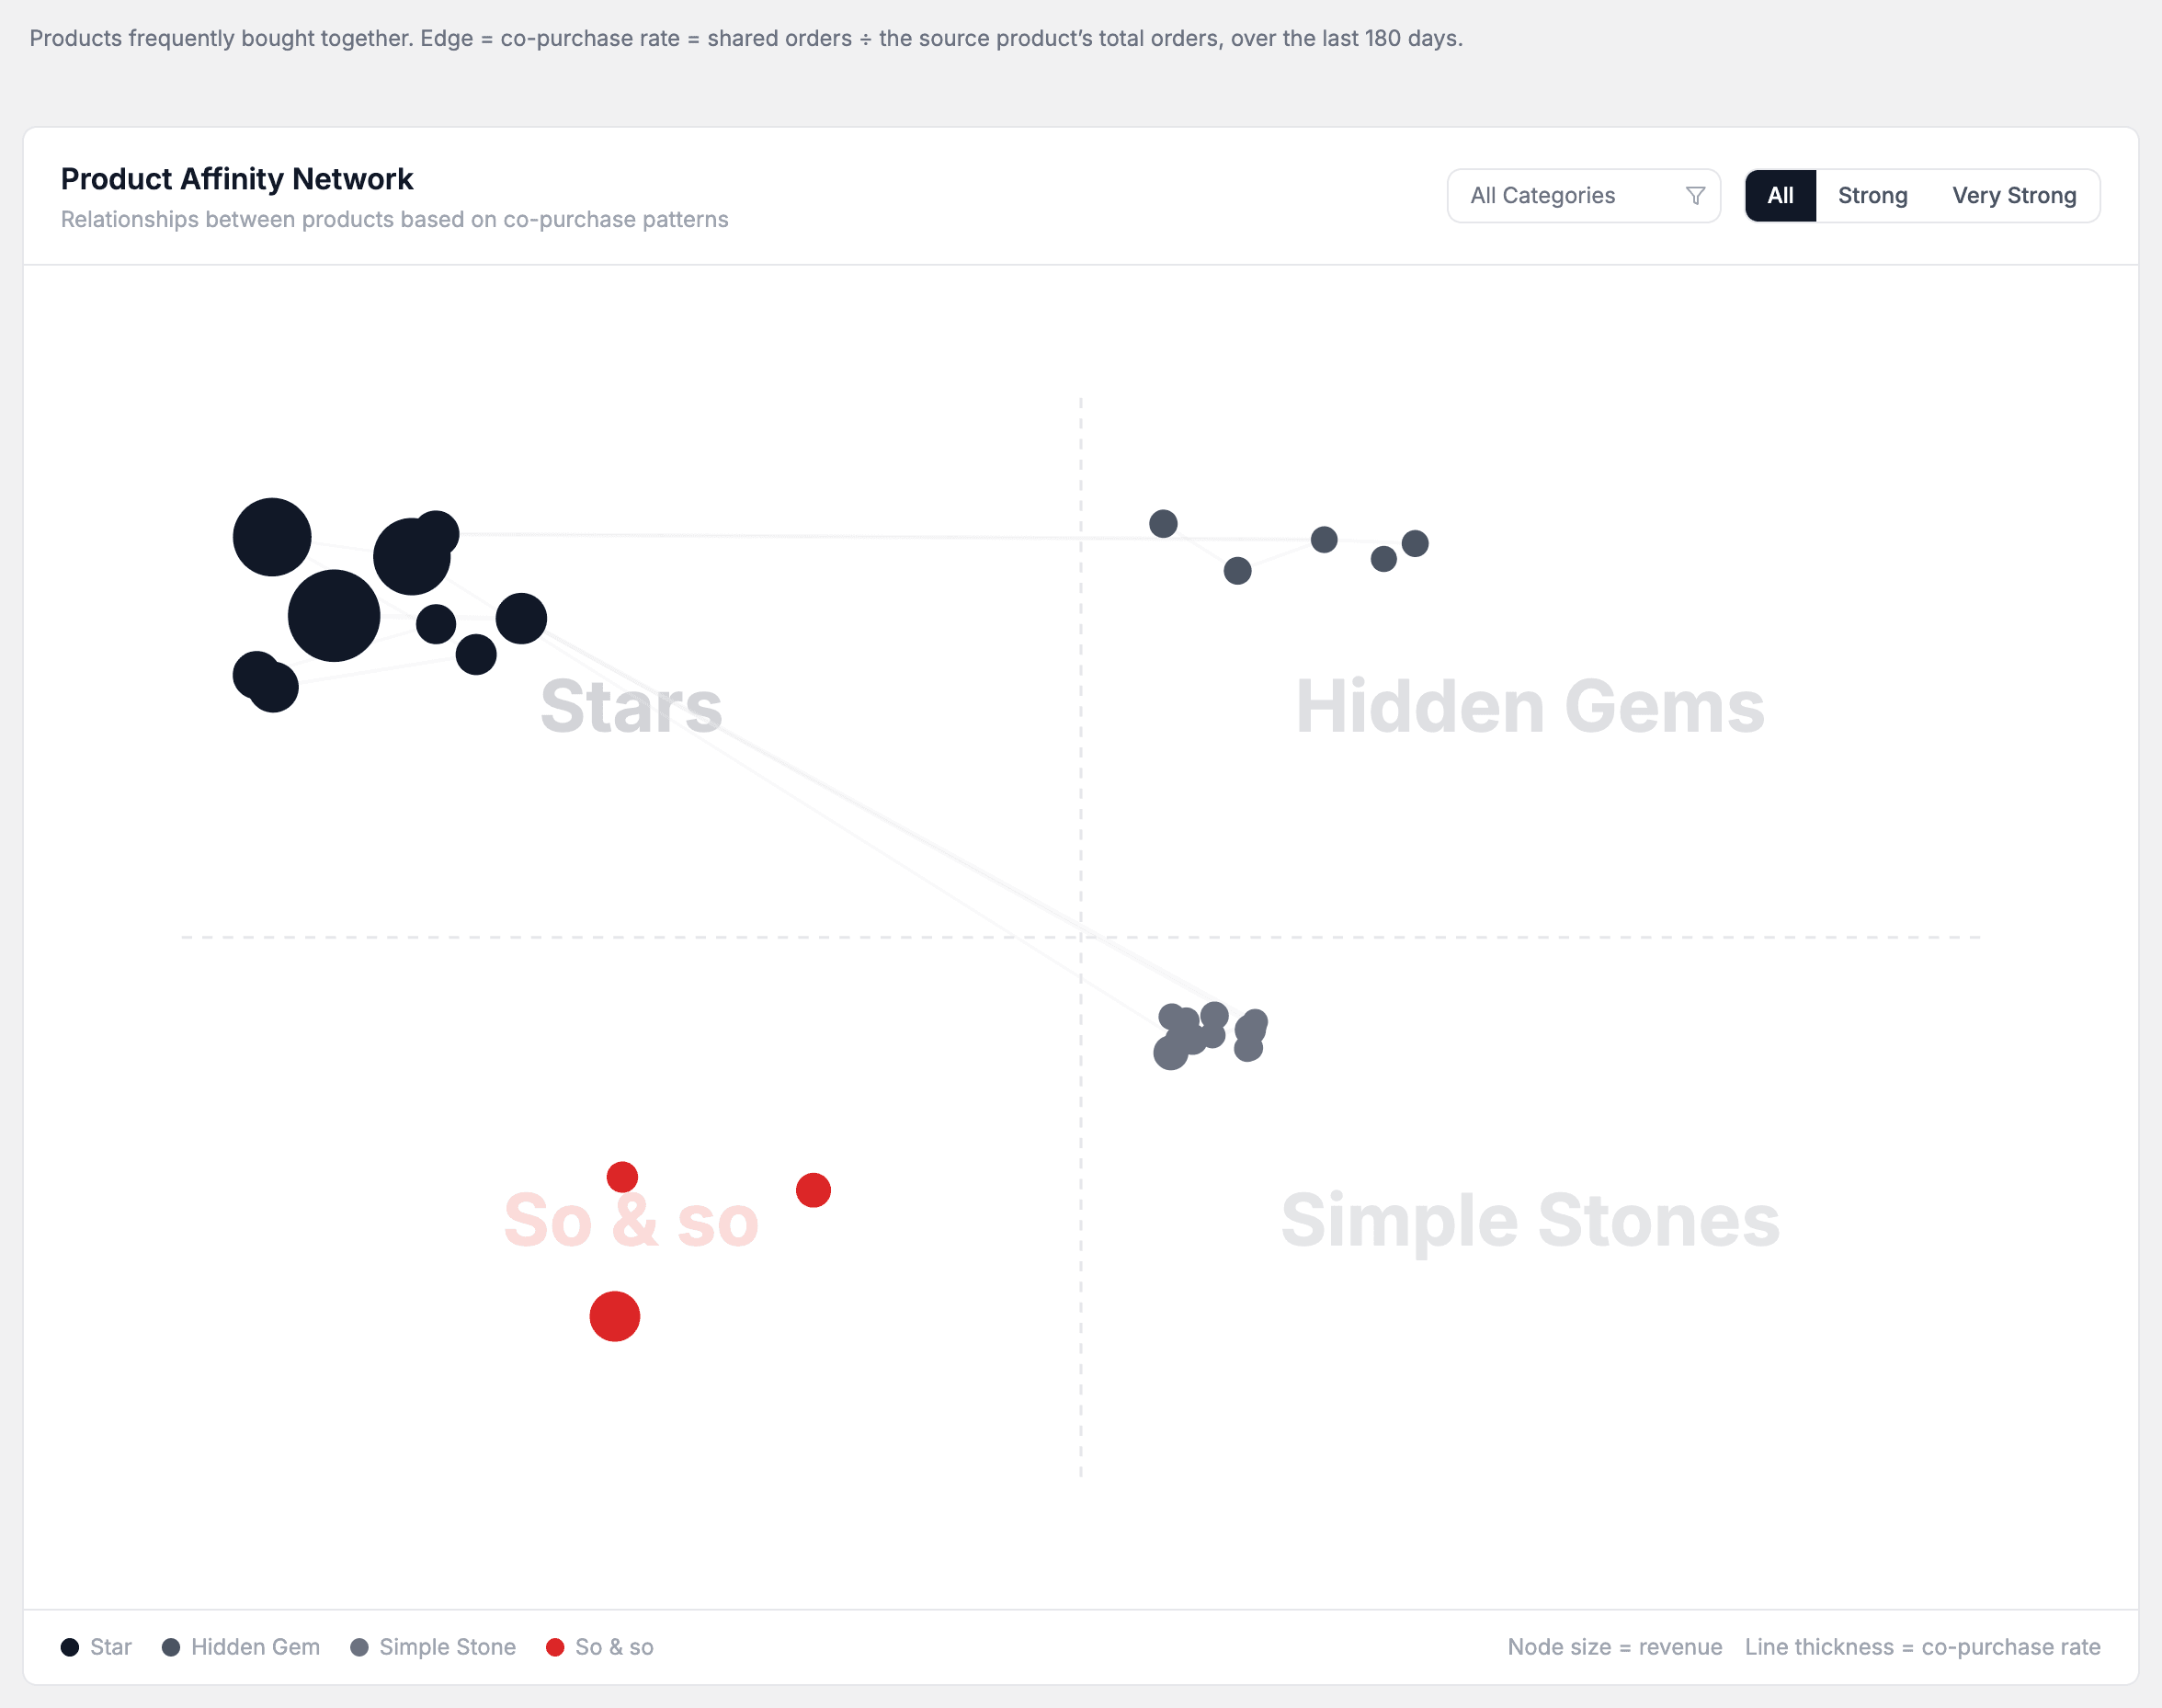
- Hover a dot to see its price, its quadrant and its Top Affinities, the three products it pairs with most.
- Click a dot to focus on it. Unrelated dots fade, and a bar below the graph shows its revenue and its number of connections.
- Select Clear selection to leave the focus.
- Use the category menu and the All, Strong and Very Strong buttons to hide weak links.
Open a Purchase Sequence
Click a row in the list to open the detail. Use the product menu to jump to another product. Use the X to return to the list.
Exact output
A summary card at the top of the page counts your gateway products and ranks the top three by Gateway strength.
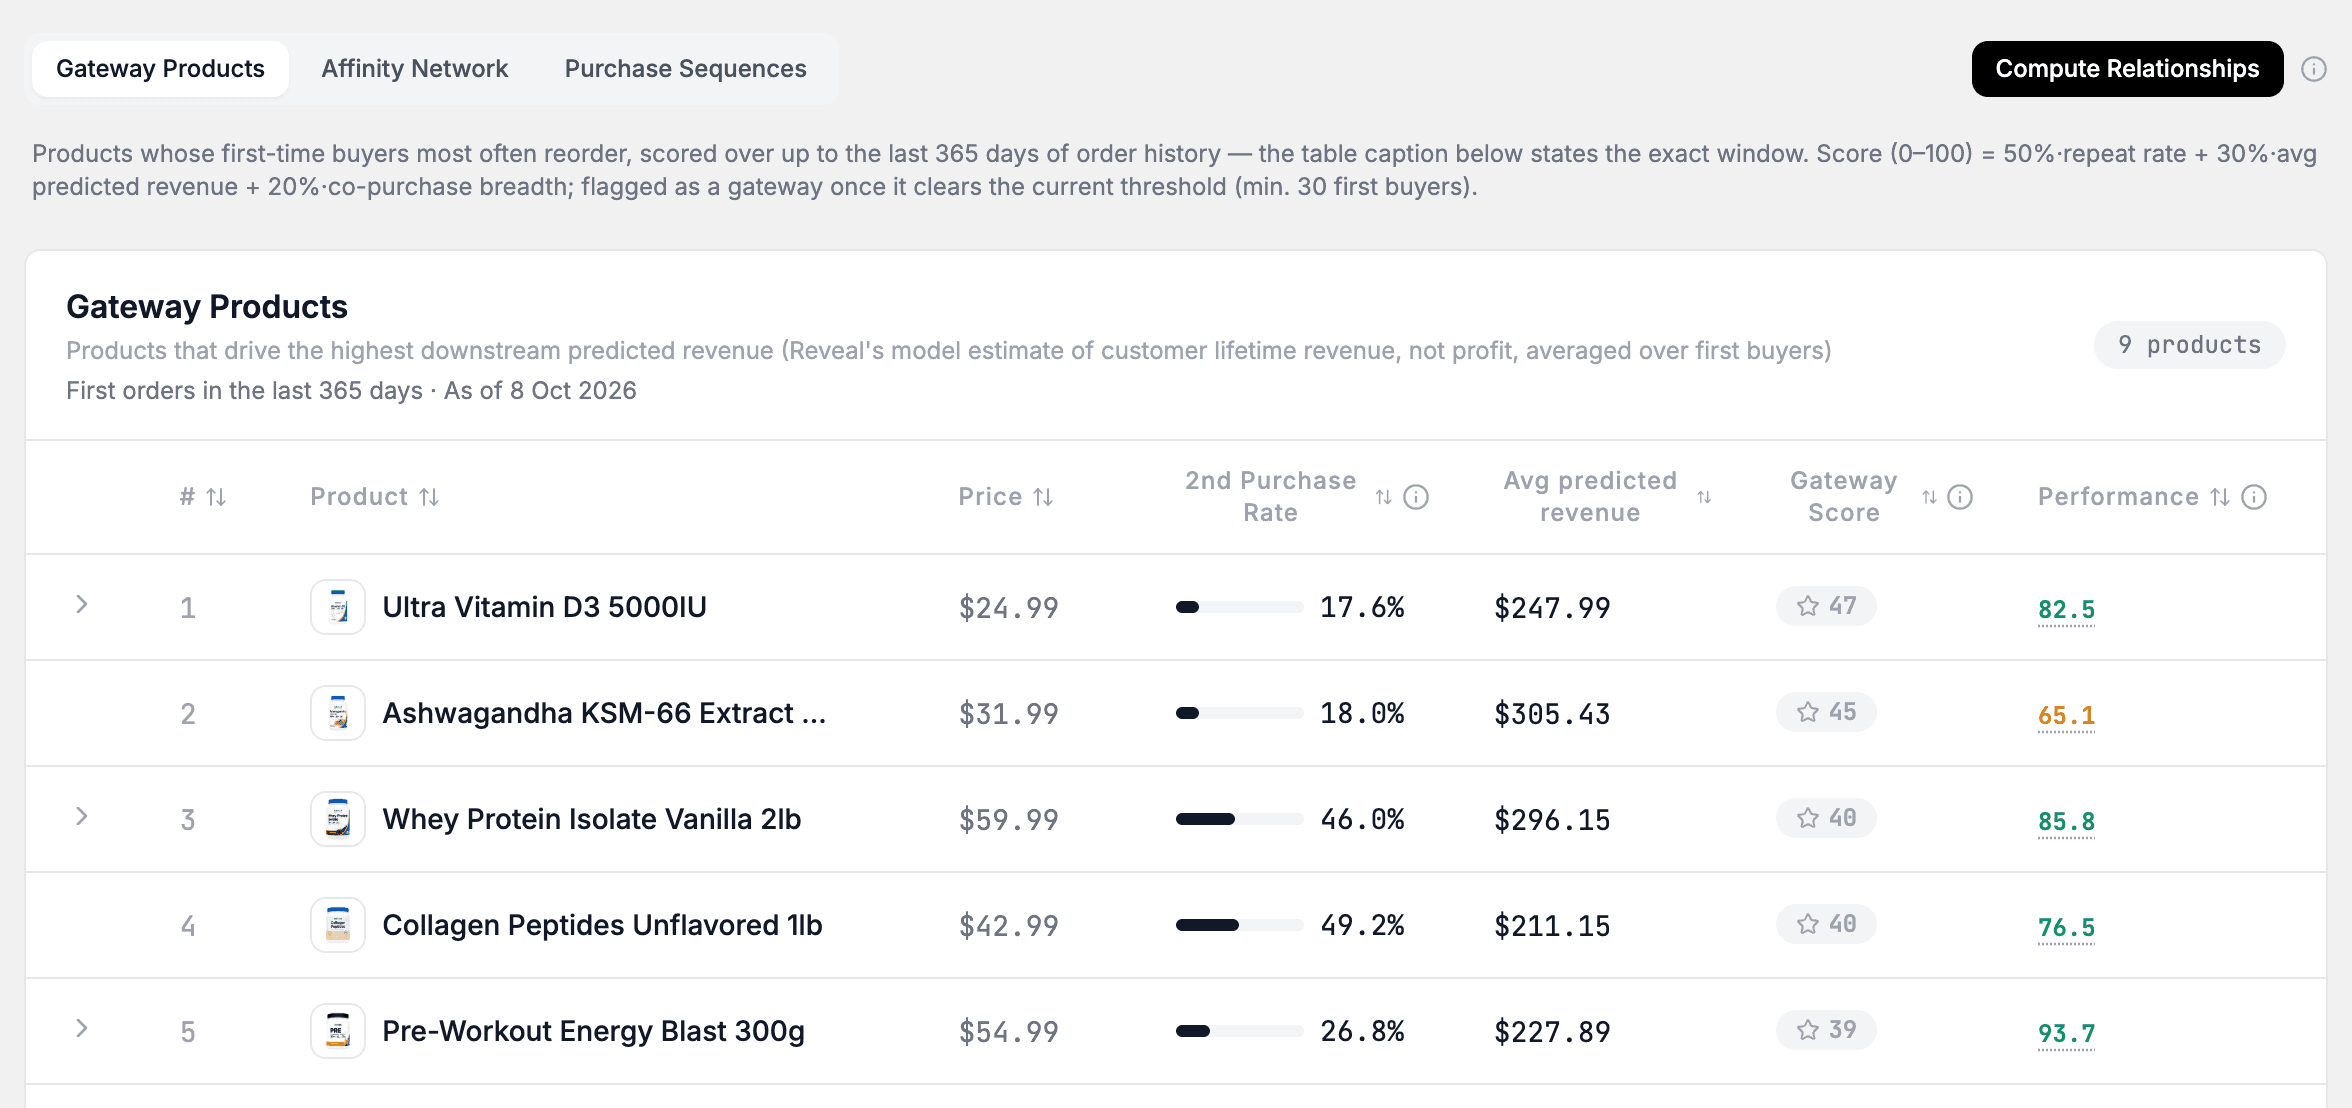
Gateway Products
The table ranks gateway products. Select a row to open Commonly Bought With, a list of products that customers often buy together with it.
| Column | What it shows |
|---|---|
| # | Rank by Gateway Score. |
| Product and Price | The product and its current price. |
| 2nd Purchase Rate | Of the customers whose first order held this product, the share who later placed a second order of any product. |
| Avg predicted revenue | A model estimate of what these first-time buyers will spend over their lifetime. It is revenue, not profit. |
| Gateway Score | A score from 0 to 100. |
| Performance | The product's Performance Score, the same number as in the Product List. A dash means no Performance Score yet. |
A caption under the title states the window and the date of the last computation, for example "First orders in the last 365 days · As of" and a date. When the window is not known, the caption reads "Gateway metrics as of" and a date. Click the info icons next to 2nd Purchase Rate, Gateway Score and Performance for plain-language explanations.
To change what counts in Performance, select a product's score in that column. Performance Score weights opens. A dash in Performance opens nothing. On a phone, each product card shows Performance too.
When the list holds only part of your gateway products, a note says "Ranked by gateway score" and column sorting is off. The count at the top right then reads "N of M products".
Affinity Network
The network is a graph of products bought together. Each dot is a product. Its color shows its quadrant. Its size shows its revenue. A line joins two products, and a thicker line means a higher co-purchase rate. The co-purchase rate is the number of orders that hold both products, divided by the first product's total orders.
The graph shows a limited set of products, the top sellers in each quadrant.
Purchase Sequences
Purchase Sequences shows what customers buy before and after a product. The list opens as Most Active Sequences. It ranks products by the number of customers analyzed. Each row shows the number of related products, the number of customers and the avg predicted revenue.
When the store has more products than the list holds, a note reads "Showing X of Y products".
In the detail, the center card is your product. Bought Before sits on the left. Bought After sits on the right. Each product carries a percentage. A bar at the bottom gives:
- Avg days to 2nd purchase
- Avg predicted revenue of first buyers
- Customers analyzed
What to do with it
| What you see | Decision or action | Owner |
|---|---|---|
| A product near the top of Gateway Products with a high 2nd Purchase Rate | Lead with it in ads for new customers. You run the ads outside Nexus, in Meta Ads Manager or Google Ads. | media buyer |
| A product in the table with a low Gateway Score | Do not lead with it when you push a first product to new customers. | ecommerce manager |
| Products listed under Commonly Bought With, or joined by a thick line in Affinity Network | Build a bundle or a cross-sell, or place them together on the product page. You make these changes in Shopify. | ecommerce manager |
| Bought After in Purchase Sequences | Plan a follow-up email or offer for the product customers buy next. You send it from your email tool, outside Nexus. | retention marketer (the person who runs email and repeat-purchase campaigns) |
| Avg days to 2nd purchase | Time the follow-up message to that gap. | retention marketer |
Expected value and measurement
Relationships can help you put ad budget behind products that bring customers back, and offer the right next product. It changes nothing in your store by itself. To check the effect, compare the same metric before and after you act:
- For ads on a gateway product, open Performance > Ad performance and compare those ads with your other ads.
- For repeat purchases, return to Insights > Products > Relationships after the next refresh. Check the 2nd Purchase Rate of the product you pushed.
Warning: other changes often run at the same time, such as new offers, price changes or seasonal demand. Nexus cannot separate the effect of one action from these. Treat a change as a signal to investigate, not as proof.
Limitations and exceptions
- Avg predicted revenue is an estimate from a model, and the Gateway Score uses it. Both can differ from what customers spend.
- If a product has too few orders, the Purchase Sequences detail reads "Not enough purchase data for this product".
- If you see "No gateway products yet" or "No purchase sequences yet", select Compute Relationships. The message may also tell you to sync your orders first. The tab has no control for that, and orders import on their own. If the tables stay empty, your store does not have enough repeat-purchase history yet.
- While a computation runs, the Gateway Products table reads "Analyzing your purchase history". Wait for it to finish.
- If Nexus cannot start a computation, a message reads "Failed to start relationship computation". Select Compute Relationships again.
- In Demo Mode, Compute Relationships is simulated. It does not recompute anything.