
Appearance
Quadrant Overview
Quadrant Overview sorts your products into four groups by how well they sell and how much customers engage with them. Open it from Insights > Products > Quadrant Overview. It is the first view on the Products page.
Problem and intended user
The ecommerce manager (the person who runs the store) needs to know which products to keep in stock, which to fix and which to stop pushing. A product can sell well and still disappoint customers, or please customers and still sell too little. The media buyer (the person who runs your paid ads) needs the same answer to choose which products get ad budget.
Current workflow
Without Nexus, a merchant ranks products by sales in a Shopify admin report or a spreadsheet. To split them into groups, they pick a cut-off by hand, such as the middle of the list. They then look up each product's reviews in the review app's own dashboard. They redo the cut-off whenever sales change.
Prerequisites
- A Shopify catalog and orders. Nexus must have synced and scored your catalog.
- At least one order and some revenue in the last 30 days for each product you want to see. Only such products are scored and plotted. A page notice says so.
- Optional: a review app or NPS data. Without them the quadrants come from Sales and Composite scores only. See Review apps and CSV import.
For the full picture of scores, see Product scores.
How Nexus works
Nexus scores each product from your orders and, when you have them, reviews and NPS. Fixed rules produce the scores. AI does not write them. Nexus ranks every selling product against your own catalog. It then places each product in a quadrant by comparing it with the median.
The median is the middle product in your selling catalog. About half of your products sit on each side of it.
The map, the cards and the leaderboards only read data. Nothing in them needs an approval. The view depends on product scoring. Scoring depends on your catalog sync. Use Update data on the Products page to refresh both. See Products overview.
Read the quadrants
| Quadrant | Sales | Engagement |
|---|---|---|
| Star | Above the median | Above the median |
| Hidden Gem | Below the median | Above the median |
| So & so | Above the median | Below the median |
| Simple Stone | Below the median | Below the median |
Explore the map
- Select a bubble to open the product in the Product List.
- Select a group of overlapping bubbles to list just those products there.
- Select the (i) icon on a card to read its definition.
See Product List.
Use the leaderboards
- Scroll down to the three leaderboard cards.
- Select Load 10 more on So & so Alerts to see more products that sell but do not engage.
- To bring back Gateway Products and Second Purchase Heroes after a filter, select Clear filters.
Exact output
The four quadrant cards
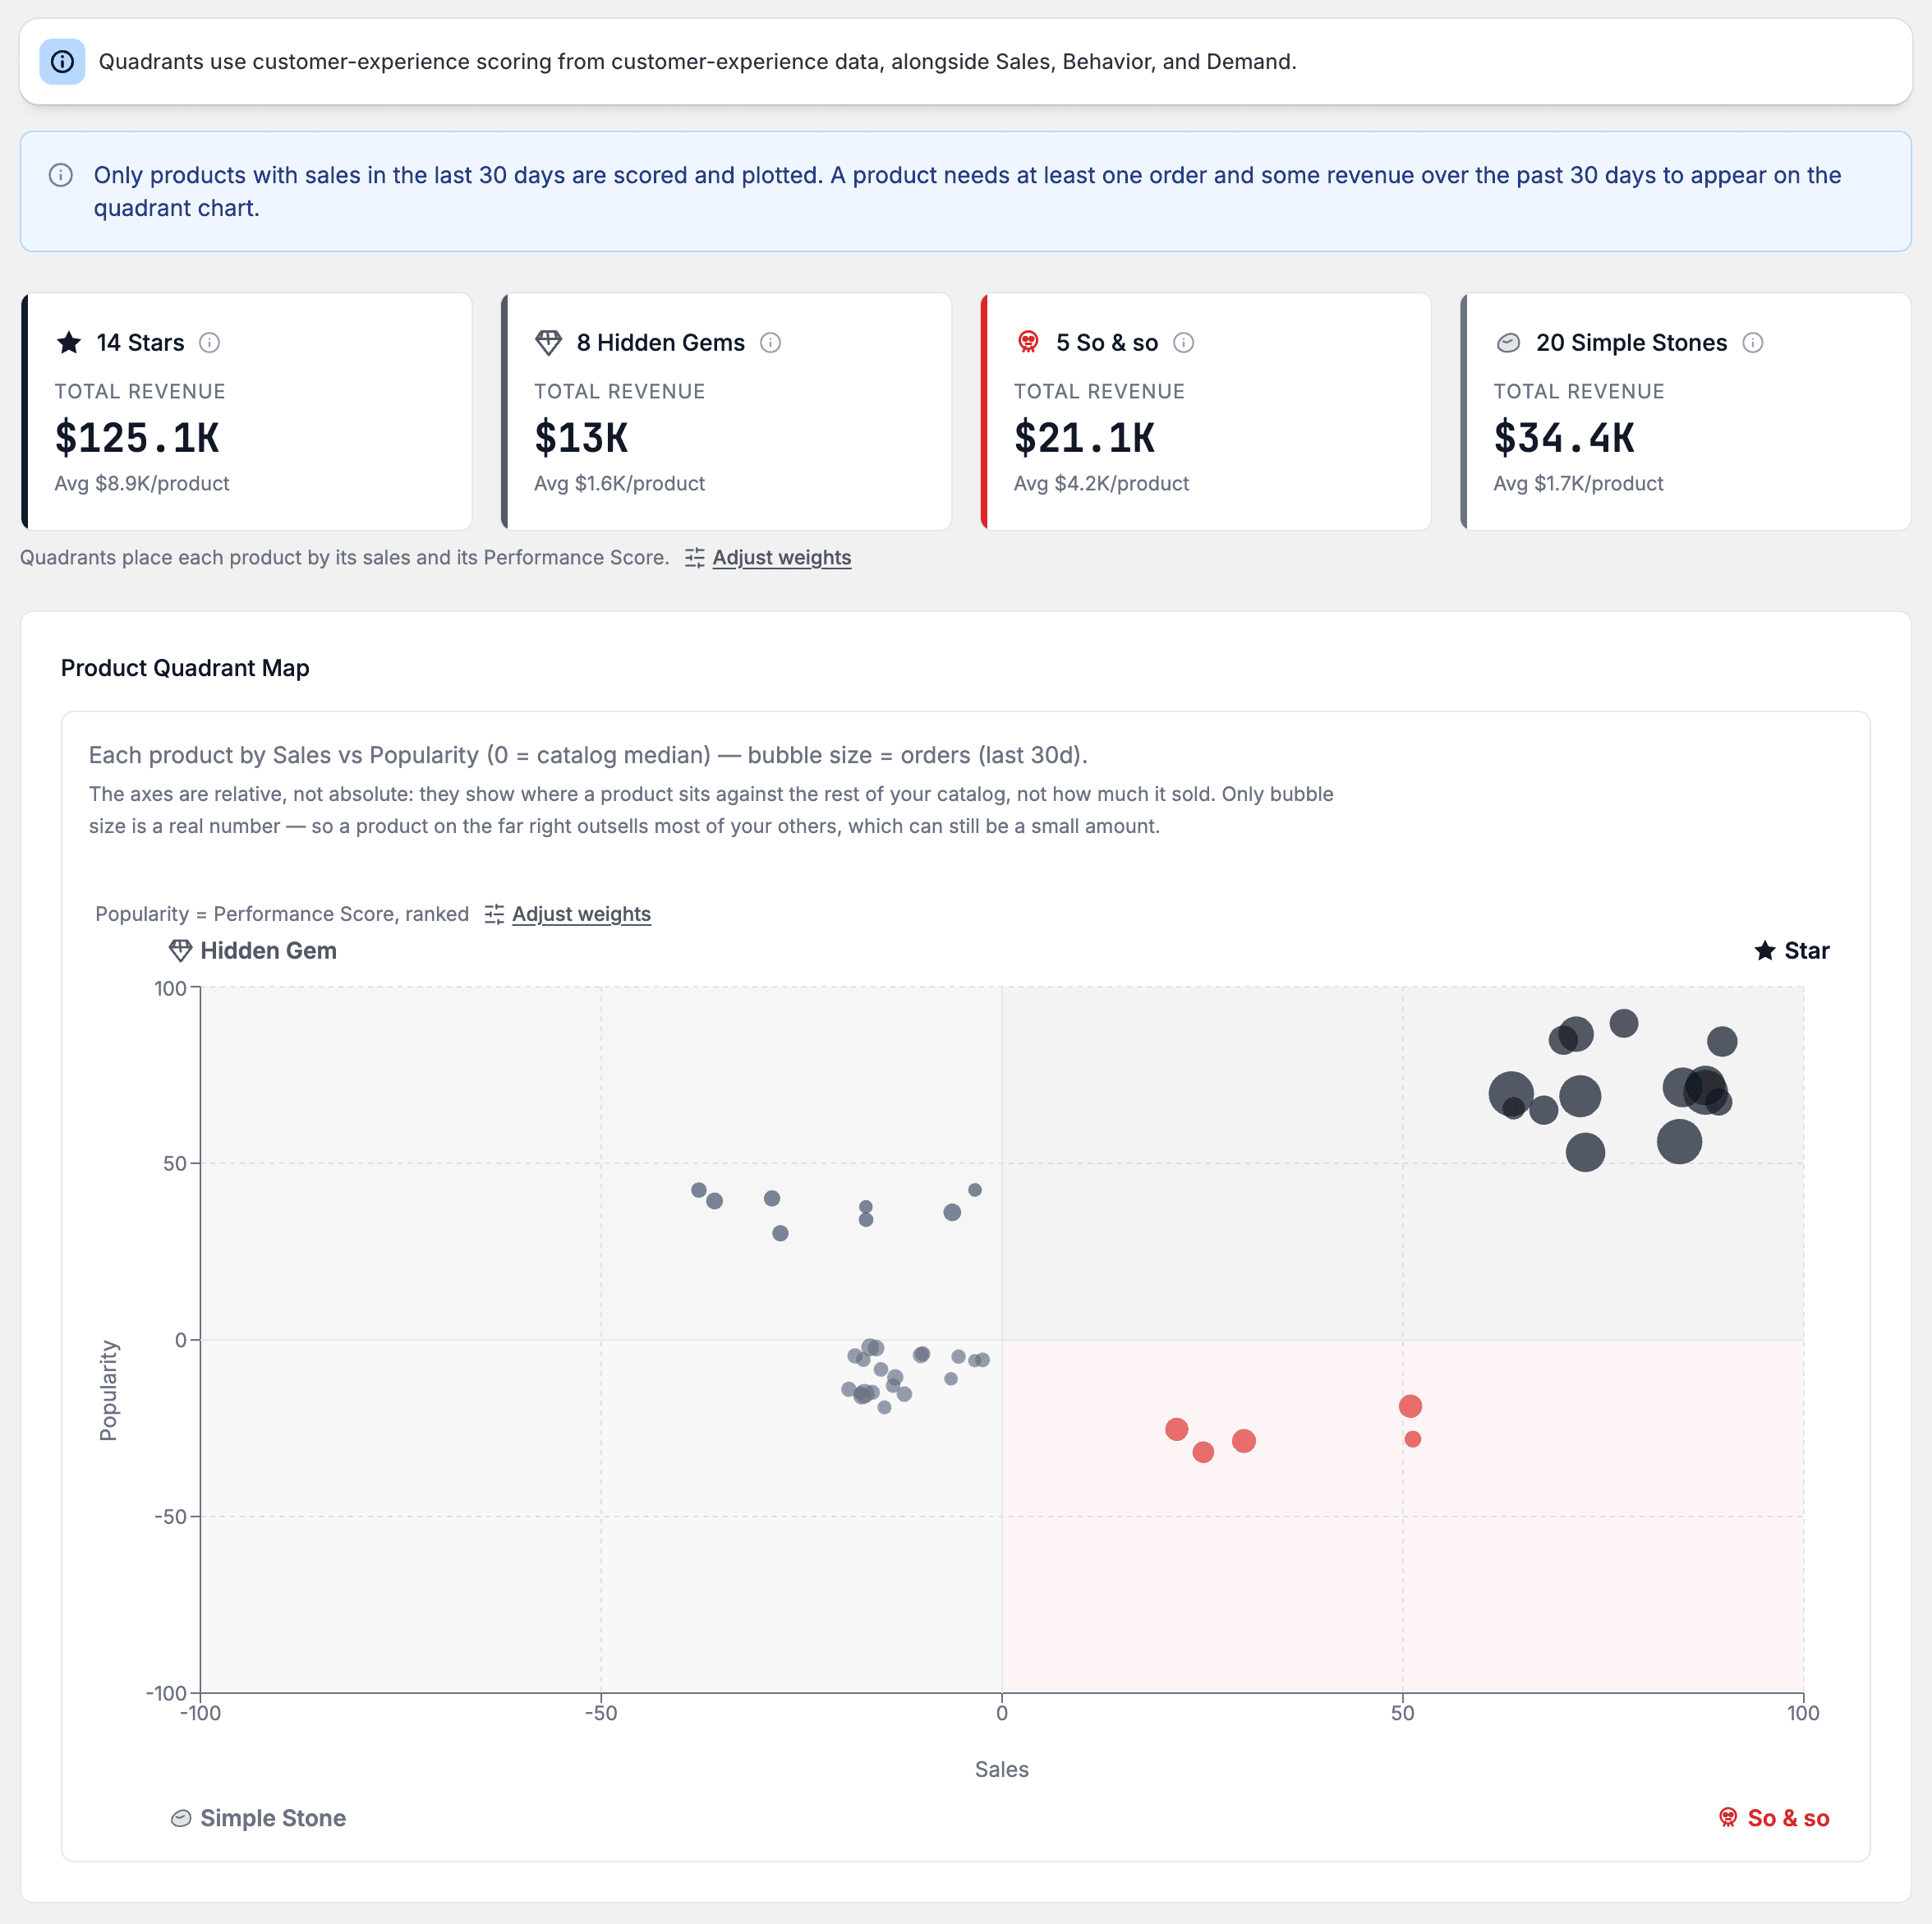
Four cards sit above the map. Each shows the number of products, their Total Revenue and the average revenue per product. A line under the cards reads "Quadrants place each product by its sales and its Performance Score." Its Adjust weights link opens Performance Score weights.
The Product Quadrant Map
The Product Quadrant Map plots each product as a bubble.
- The horizontal axis is Sales.
- The vertical axis is Popularity, which is customer engagement. It ranks the Performance Score. Adjust weights beside it opens Performance Score weights.
- Both axes run from -100 to +100. Zero is the catalog median.
- Bubble size is the number of orders in the last 30 days.
WARNING
The axes are ranks, not amounts. A product far to the right outsells most of your other products. That can still be a small amount of money.
Nexus hides extreme outliers from the map so they do not squash the rest. A note above the map says how many, and the tables still count them. On a large catalog, the map shows a sample of your selling products. A caption above the map says so and gives the sample size and the limit for each quadrant. The four cards always count every selling product.
The scoring banner
A banner above the cards tells you what drives the quadrants.
- Customer-experience data present. The banner says quadrants use review or NPS scoring, with Sales, Behavior and Demand.
- No customer-experience data. The banner says you have no reviews or NPS responses yet. Quadrants come from Sales and Composite scores only.
The three leaderboards
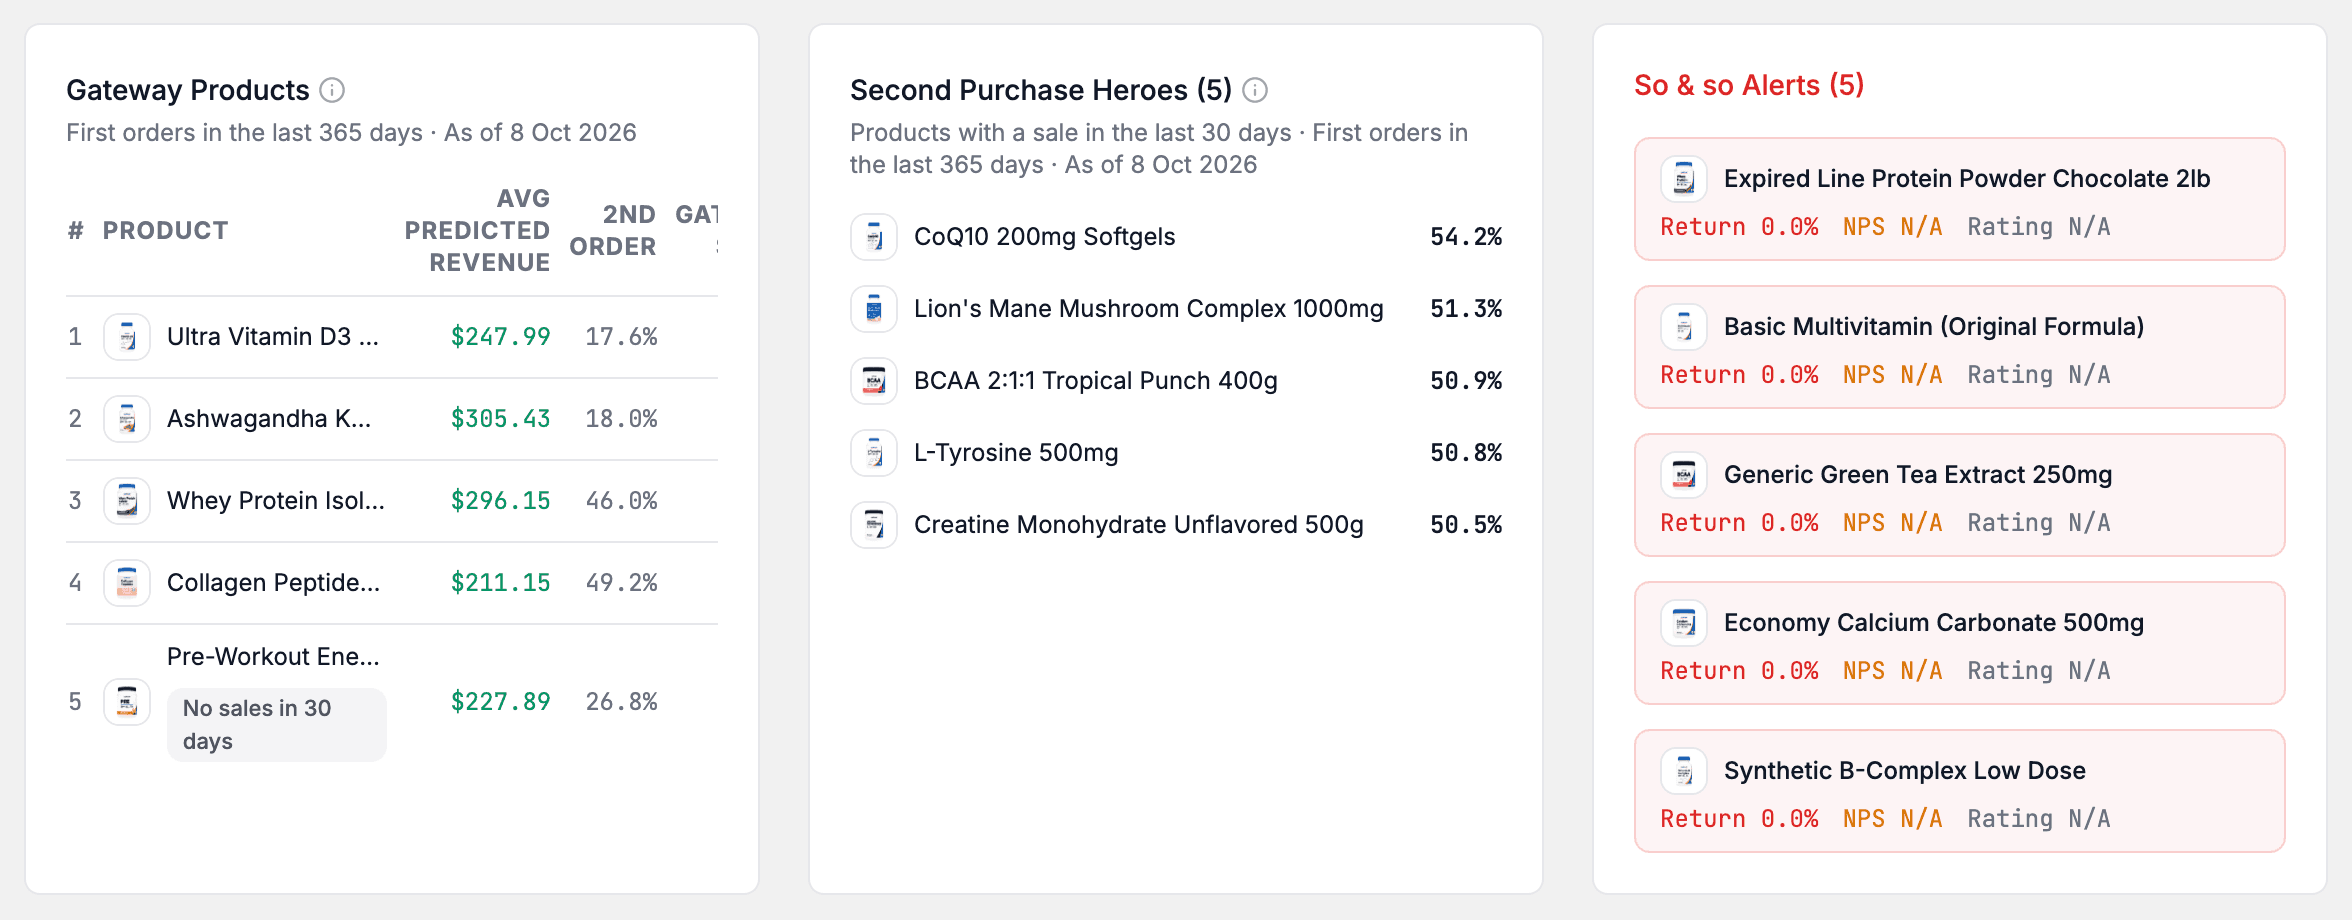
Gateway Products lists products that attract valuable first-time buyers. Its columns are #, Product, Avg predicted revenue, 2nd Order, Gateway Score and Performance. Avg predicted revenue is a lifetime revenue estimate, not profit. A line under the Gateway Products and Second Purchase Heroes titles names the data window and the date Nexus last computed the figures. A gateway with no recent sale shows a No sales in 30 days or Not on chart tag.
Performance is the product's Performance Score, the same number the Product List shows. A gateway with no Performance Score yet shows a dash. Select a score to open Performance Score weights. Select the info icon beside Gateway Score or Performance for a plain-language explanation. On a phone, the card scrolls sideways to show every column.
Second Purchase Heroes ranks products by a percentage. The percentage is the share of new customers who ordered again after buying that product.
So & so Alerts lists products that sell but do not engage, with Return, NPS and Rating. On a very large catalog, a note says the list covers only the products in the map sample.
What to do with it
| What you see | Decision or action | Owner |
|---|---|---|
| Star | Keep investing in marketing. Keep them in stock. | media buyer and ecommerce manager |
| Hidden Gem | Customers like them but too few buy. Try ads, bundles or better placement. Set these up in Meta Ads Manager, Google Ads or Shopify admin, outside Nexus. | media buyer |
| So & so | These products sell, but customers do not engage. Find out why buyers do not come back. Check Return, NPS and Rating in So & so Alerts. | ecommerce manager |
| Simple Stone | Bundle them with Stars or run targeted promotions. Do this in Shopify admin, outside Nexus. | ecommerce manager |
| Gateway Products | Use these products for acquisition ads. | media buyer |
| Second Purchase Heroes | Feature these products in campaigns that bring buyers back. | retention marketer (the person who runs email and repeat-purchase campaigns) |
| Products with no recent sale | Open Catalog Health to review your whole catalog. | ecommerce manager |
Expected value and measurement
The view can help you focus ads, stock and fixes on the products that matter.
To check the effect, compare over equal periods:
- The product count and Total Revenue on each quadrant card in Insights > Products > Quadrant Overview. A Hidden Gem you promoted can move toward Star.
- Return, NPS and Rating in So & so Alerts, on this page, for a product that sold but did not engage and that you fixed.
- Ad results for a product you promoted in Performance > Ad performance, grouped By product.
A quadrant is a rank against your own products. A product can move because other products moved. Promotions, price changes and seasons usually run at the same time. Nexus cannot isolate the effect of one action.
Limitations and exceptions
- Only products with at least one order and some revenue in the last 30 days appear. A product with none shows Not scored in the Product List and has no quadrant.
- Avg predicted revenue is an estimate of lifetime revenue, not profit. It can be wrong.
- On a large catalog the map shows a sample, and the list of products that sell but do not engage in So & so Alerts can be incomplete. A caption or note says so.
- Gateway Products and Second Purchase Heroes need an unfiltered view. With a search, quadrant, category or attribute filter on, they show "Leaderboards need an unfiltered view". Select Clear filters to bring them back.
- Connect a review app to use customer-experience scoring.
- If loading fails, the view shows "Couldn’t load product scores" with the reason. Reload the page. If it persists, see Troubleshooting.
- While the full import runs, a notice at the top says what is still in progress, such as "the rest of your order history". Some numbers can be thin until it finishes.
| Message | What it means |
|---|---|
| No product scores yet | Nexus has not produced scores yet. Wait for scoring to finish. |
| No products with recent sales yet | Products are scored, but none sold in the last 30 days. See Catalog Health for your whole catalog. |