
Appearance
Product List: compare, filter and export your products
The Product List shows one row per product with its scores side by side. Use it to find your best and worst products, export them, or pick products for new ads. To open it, go to Insights > Products > Product List.
Problem and intended user
The ecommerce manager (the person who runs the store) needs to compare many products on one screen. The media buyer (the person who runs your paid ads) needs a short list of products worth advertising. The creative strategist (the person who plans and makes ad creatives) needs to hand those products to the next batch. The need arises whenever you choose products to push, fix or drop.
Current workflow
Without Nexus, a merchant exports product sales from Shopify admin reports into a spreadsheet. They add margin from their own cost sheet and ratings from the review app's dashboard, then filter and sort by hand. They copy product names into the ad tools or send them to an agency.
Prerequisites
- A Shopify catalog that Nexus has synced and scored.
- The cost per item on your products in Shopify admin, for the Margin column. Nexus has no screen to enter a cost per item. For a product with no cost, Nexus uses the Average product margin (%) that you set in Install and first setup.
- GA4 for the GA4 Tier, Recommendation and GA4 CR columns and the Demand score. See Google Analytics 4.
- A review app or NPS data for the CX score. See Review apps and CSV import.
While Nexus prepares your data, a notice at the top of the page says what is still in progress, and some numbers can be thin. If your catalog changed in Shopify, open Update data at the top of the page and choose Refresh updated products.
How Nexus works
Nexus reads your catalog and orders, plus reviews, NPS and GA4 data when connected. Fixed scoring rules, not AI, produce every score. See Product scores.
Sorting, filtering and Export CSV only read data. Generate creatives opens the creative wizard. You choose the options there, and nothing is generated before you press Generate.
Choose and sort columns
Select Columns to show or hide a column. The picker also offers Price, GA4 Tier, Recommendation, GA4 CR and Avg predicted revenue. Your choice stays in your browser. The picker says Repurchase Rate, where the header says Repurchase.
GA4 Tier and Recommendation come from the latest classification. The Classify action in Update data runs a new one.
Click a column header to sort. Click again to reverse. The list opens sorted by Performance, highest first. Products without a Performance Score sort last.
To change what counts in Performance, select a product's score in that column, or the sliders icon beside its header, Adjust Performance Score weights. You can also select Update data, then Adjust weights under Analysis. Performance Score weights opens. A dash in Performance opens nothing. After you save, the list follows the new scores.
Filter the list
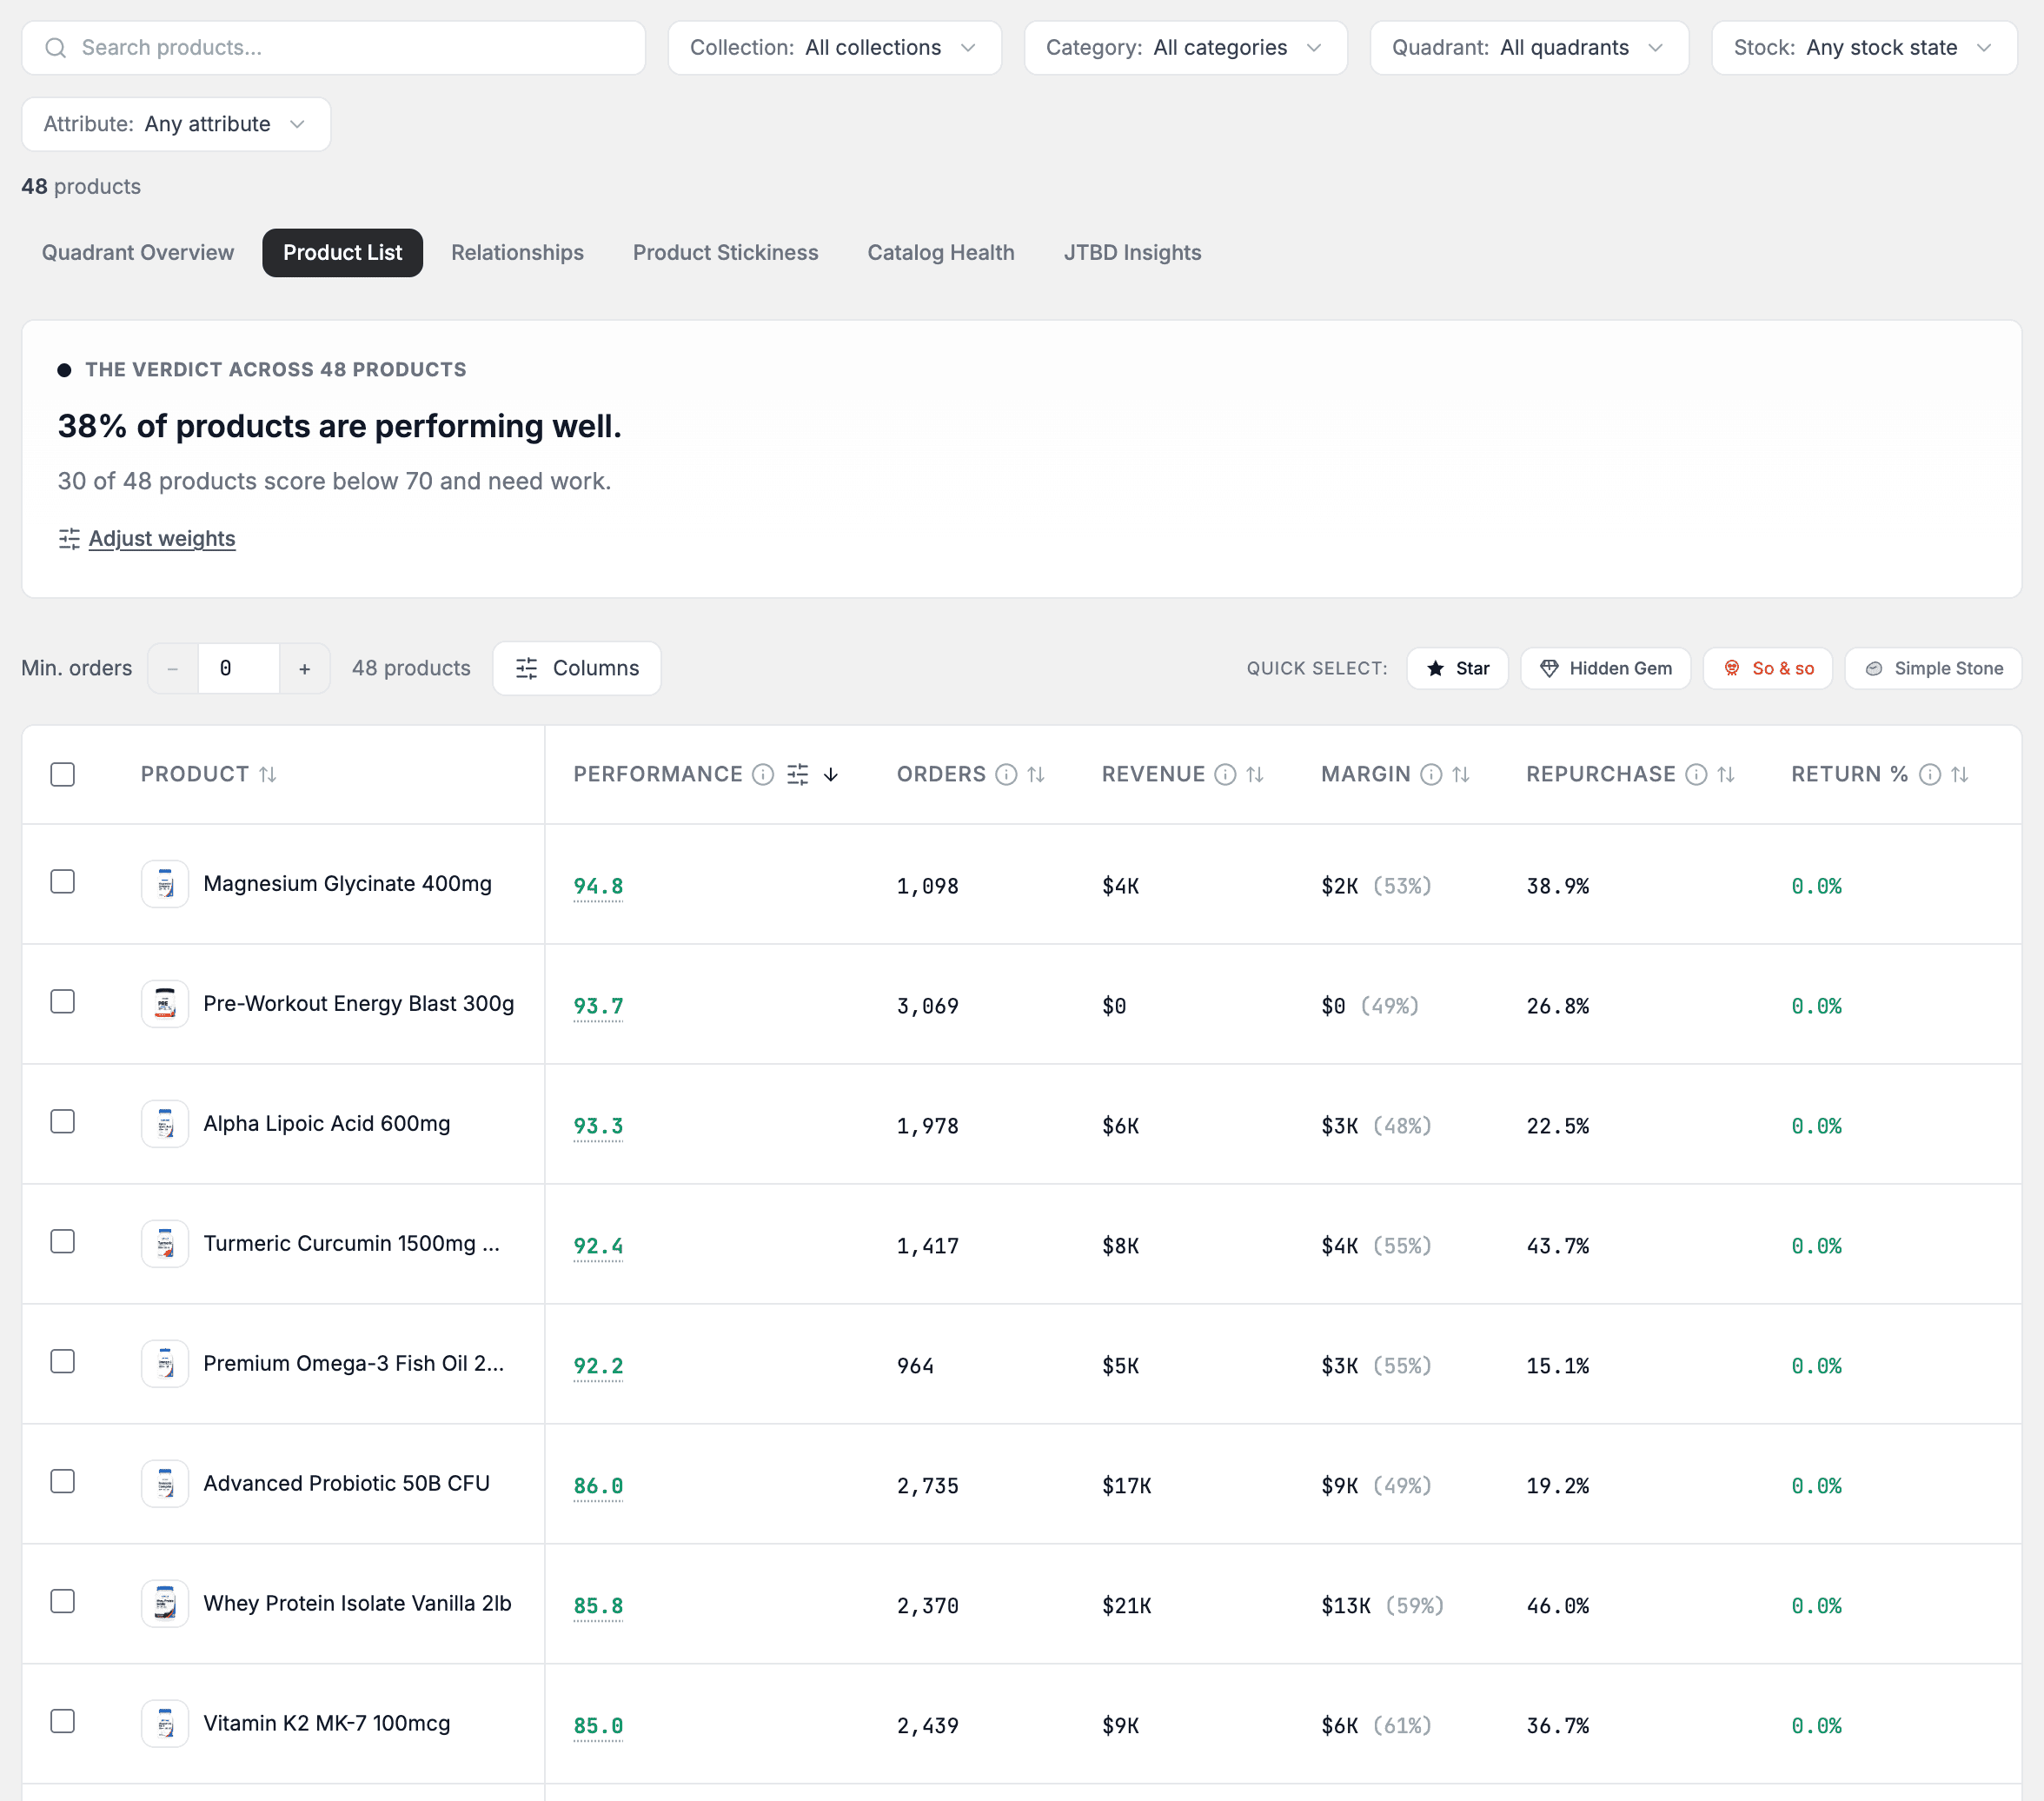
The filter bar above the tabs narrows every Product tab at once. It offers:
- A search by product name.
- Collection, Category (when your catalog has categories) and Quadrant.
- Stock: In stock, Low stock or Out of stock.
- Attribute: Gateway, Sticky, Bestseller or Second purchase hero.
Select Clear filters to reset the bar. A counter under the bar shows the number of products. When a filter is on, it reads "Showing N of M products". When Nexus cannot know the exact result count, it reads "Filtered from M products". This happens with a stock or attribute filter.
Inside the tab, Min. orders hides products with fewer orders than your number. Type a value or use the minus and plus buttons. The highest value is the largest order count in your catalog. Select Reset to clear it.
If you clicked a group of dots on the Quadrant Overview chart, a chip reads "Showing N products selected from the chart". Select its x to see the full list again.
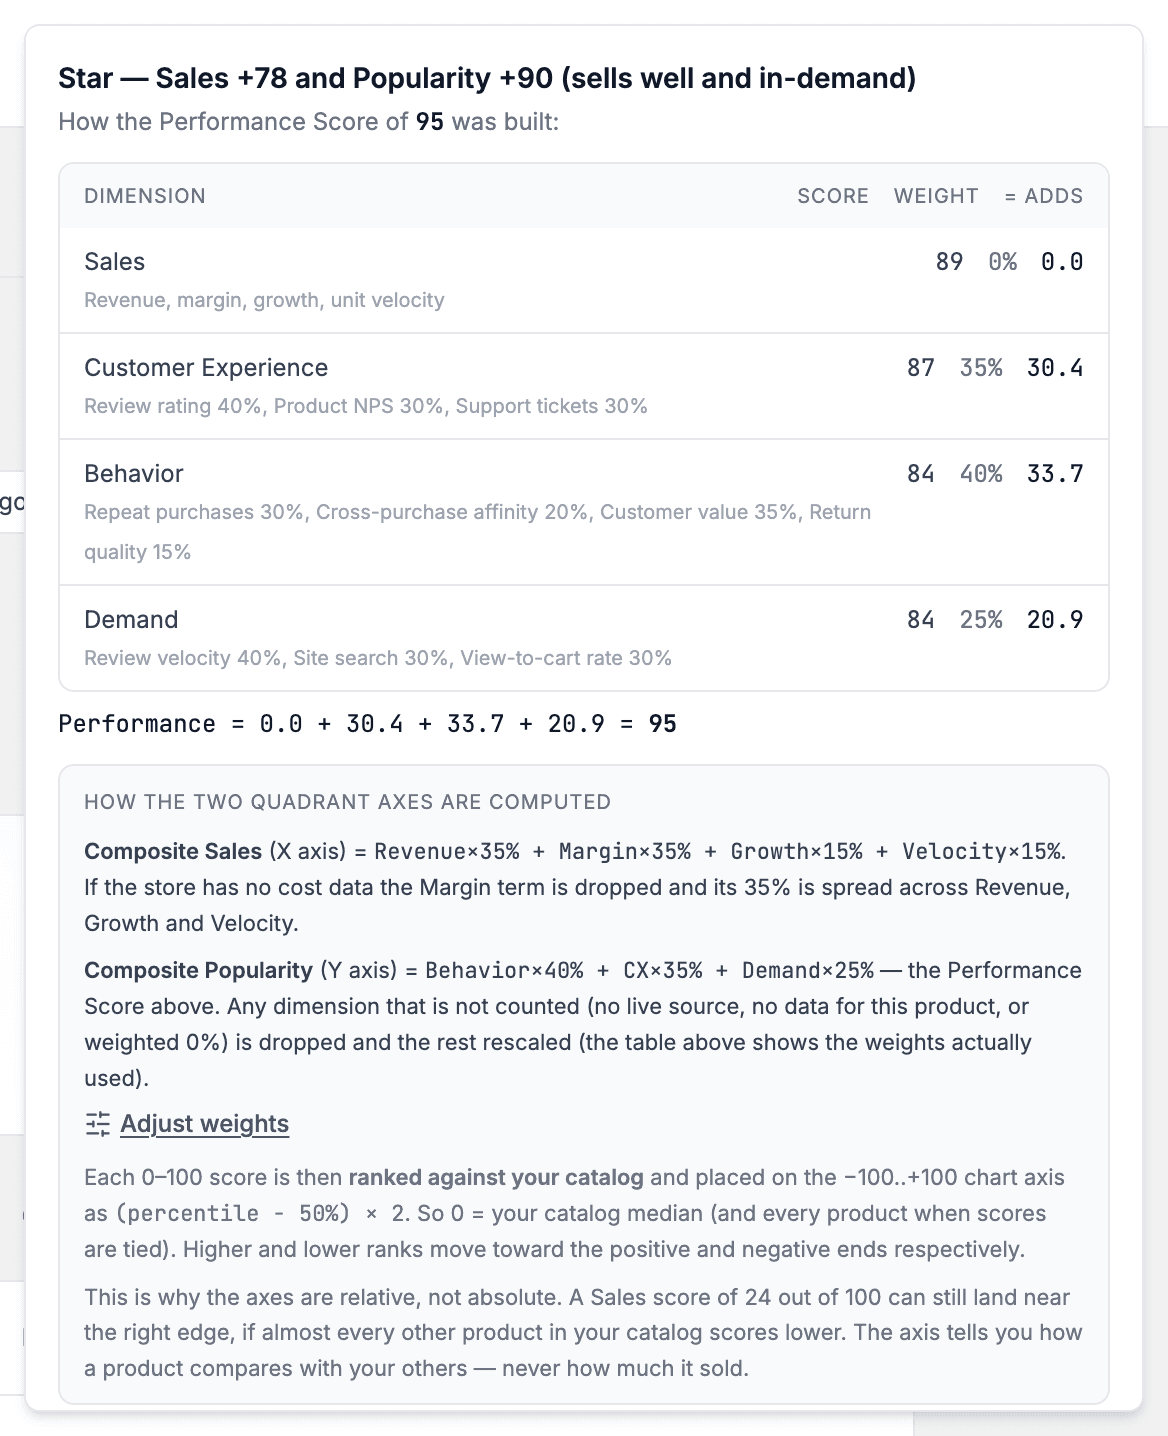
See why a product has its quadrant
- Select Why? on a row.
- Read the quadrant rule at the top of the panel.
- Read the table below it. It has Dimension, Score, Weight and = Adds. The adds sum to the Performance score. Weight shows the weights your store uses.
- To change the weights, select Adjust weights. Performance Score weights opens with this product in the preview.
A dimension with no data source shows "no data source", and Nexus shares its weight across the others. A dimension that the score leaves out, for example because your weights set it to 0%, shows Not counted.
For a product with no Performance Score, the panel says that the product has no Performance Score yet. The sum line reads No score yet instead of a total, and Adjust weights does not show. The table then has only Dimension and Score. Sales, Behavior and Demand show a dash, as in the list, because they need order data from Reveal. Customer Experience keeps its score when the product has reviews.
Open a product
Click a product name to open Product details in a large window. Close it with the X in the title bar. Product detail explains what the window shows. To see the same view as a full page, right-click the product name and open it in a new tab.
Select See Synthesis on a row to open Creative synthesis for that product.
Select, export and make creatives
WARNING
After Select all, Export CSV reads every page in your browser. Keep the tab open until Export ready appears. Leaving the tab stops the export.
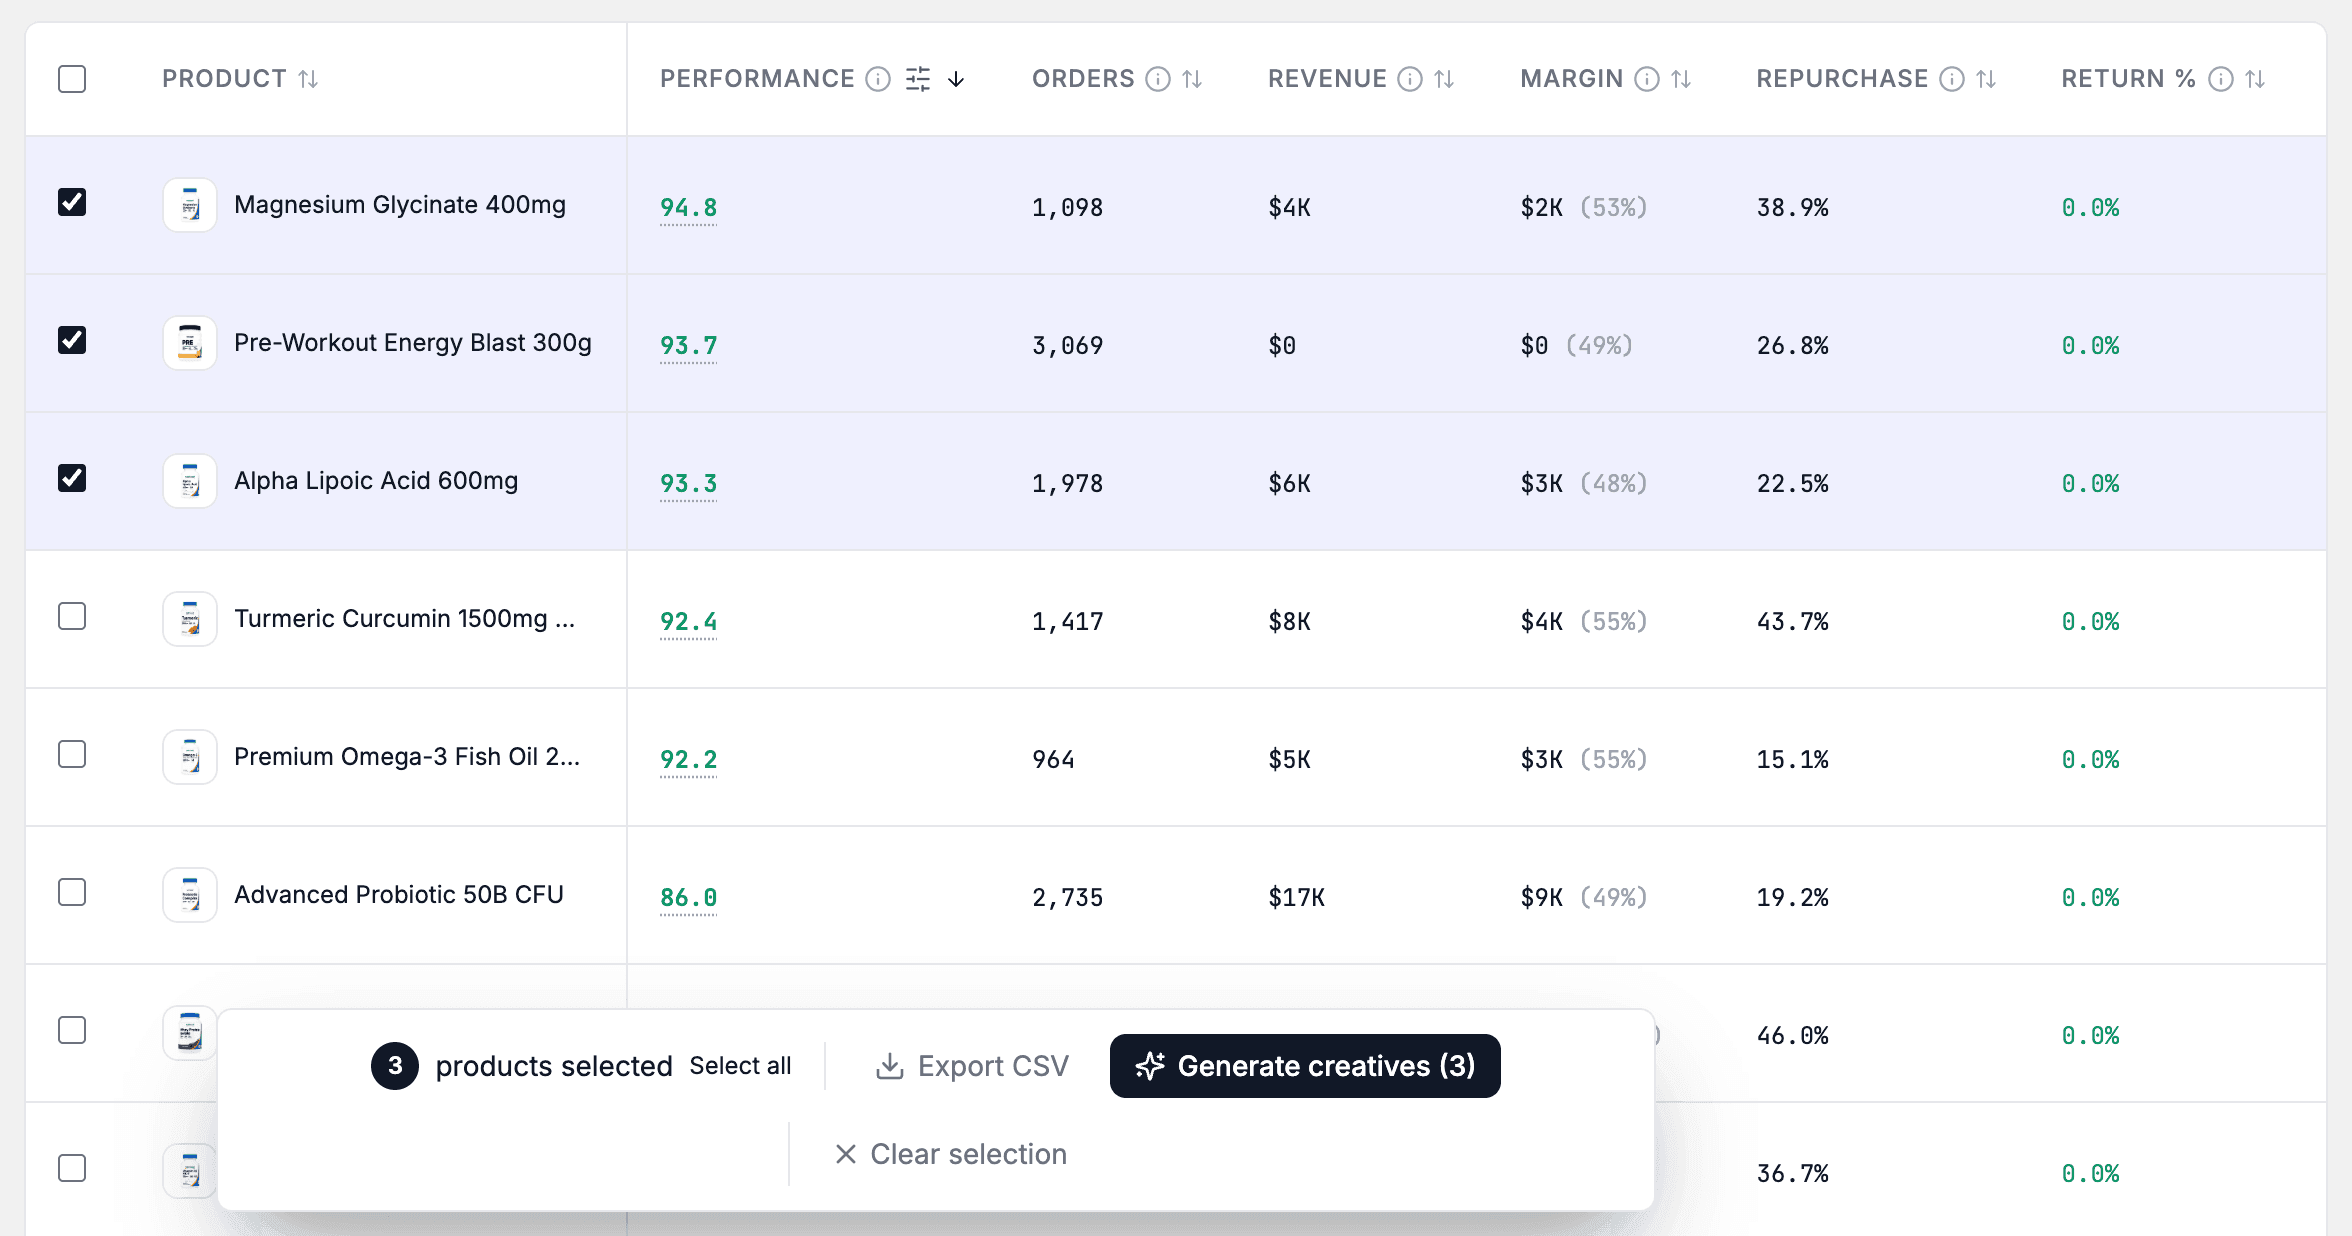
- Tick the box on a row to select it. The header box selects every row on the page. The Quick Select buttons tick the products of one quadrant on the page you see.
- Read the bar at the bottom. It reads "N products selected" and offers Select all, Export CSV, Generate creatives (N) and Clear selection.
- Choose an action.
- Select all selects every product that matches your filters, on all pages.
- Export CSV downloads the selected products as a file. After Select all, Nexus reads every page first. A progress bar shows the state, and Export ready appears at the end.
- Generate creatives opens the creative wizard with your ticked products, in table order. The wizard takes a limited number of products. It prints the limit as Choose up to 10 products, and the number in the button shows how many it carries. Select all does not change this. Nothing is generated until you press Generate in the wizard. Generate does not use your credits, but limits apply. See Generate a creative batch.
Exact output
The table
Each row is a product. The default columns are:
| Column | What it shows |
|---|---|
| Performance | The overall score, from 0 to 100. Select it to open Performance Score weights for that product. |
| Orders | Delivered orders that contain the product. It counts orders, not units. It covers the last 365 days. On a very large catalog the period can be shorter. Hover the info icon for details. The period is longer than the 30 days of Revenue and Margin. |
| Revenue | Net product revenue for the last 30 days, after refunds. |
| Margin | Gross margin for the last 30 days. The margin percentage shows beside the amount. It shows N/A when your store has no product cost data. |
| Repurchase | Of the customers whose first order held this product, the share who ordered again. The first order must fall in the last 365 days. |
| Return % | The share of order lines for this product that were returned, over the last 365 days. It turns yellow above 8% and red above 15%. |
| Quadrant | Star, Hidden Gem, So & so or Simple Stone. |
| Composite Sales and Composite Popularity | The two quadrant axes. Each product is ranked against your own catalog, from -100 to +100. 0 is the median. A dash means the product is not ranked. In Composite Popularity, it can also mean that Nexus had no order data for the product in its latest scoring run. |
| Sales | The score behind Composite Sales, from 0 to 100. It is not part of Performance. |
| CX, Behavior, Demand | The three groups behind Performance, each from 0 to 100. A group shows Not counted when your weights set it to 0%, or when the product has no data for any signal you weighted in it. |
| Why | A button that explains the quadrant. |
A dash in Performance, Sales, Behavior or Demand means Nexus has no score for that product. It has not scored it yet, or had no order data for it in its latest scoring run. A dash in CX means the product has no review data. A product with no sales in the last 30 days shows Not scored in Quadrant.
The Why? panel and the selection bar appear on demand. See the steps above.
What to do with it
| What you see | Decision or action | Owner |
|---|---|---|
| Top and bottom rows by Performance | Decide which products to push, fix or drop. | ecommerce manager |
| Star or Hidden Gem in Quadrant | Choose these for ads. Run the ads in Meta Ads Manager or Google Ads, outside Nexus. | media buyer |
| Return % in yellow or red | Find out why customers return the product. Act in Shopify admin or with your supplier, outside Nexus. | ecommerce manager |
| Margin shows N/A | Add the cost per item to your products in Shopify admin. Nexus has no screen to enter it. | ecommerce manager |
| A Performance order that does not match what matters in your store | Change the weights in Performance Score weights. | ecommerce manager |
| Ticked rows and Export CSV | Download the products for a spreadsheet or to share. | ecommerce manager |
| Ticked rows and Generate creatives (N) | Start a creative batch for those products. | creative strategist |
| See Synthesis on a row | Open Creative synthesis for that product. | creative strategist |
Expected value and measurement
To check a decision, compare over equal periods:
- Revenue, Margin, Repurchase and Return % for the product in Insights > Products > Product List. Orders covers a longer period than Revenue and Margin.
- Ad results for products you promoted in Performance > Ad performance, grouped By product.
Promotions, price changes, seasons and new ads usually run at the same time. Nexus cannot isolate the effect of one action.
Limitations and exceptions
- A dash in a score cell is unknown, not low. Performance, Sales, Behavior and Demand need order data from the latest scoring run. CX needs review data. A product with no sales in the last 30 days shows Not scored.
- Avg predicted revenue is an estimate of lifetime revenue, not profit.
- With no match, the table shows "No products match". Try clearing the search, quadrant, or minimum-orders filters.
- If the list fails to load, the table shows "Couldn’t load products" with the reason. Reload the page.
- If an export fails, the message Export failed gives the reason. Run Export CSV again.
- In Demo Mode, the Update data actions are simulated and do not change the demo data. Generate creatives opens the wizard, but the wizard does not make a batch.