
Appearance
Product detail: one product, all its signals
Product detail puts what Nexus knows about one product on one page. Use it to see why a product scores as it does.
Problem and intended user
The ecommerce manager (the person who runs the store) needs to know why a product scores high or low. The media buyer (the person who runs your paid ads) and the creative strategist (the person who plans and makes ad creatives) need to choose what to promote. Scattered answers can send ad money to the wrong product.
Current workflow
To learn why one product performs as it does, you open that product in Shopify admin for its price and sales, read its reviews in the review app's own dashboard, and check its ads in Meta Ads Manager or Google Ads. You then copy those figures into one spreadsheet row for the product.
Prerequisites
- A product synced from your store and scored.
- Order data, for Orders and Customers.
- Reviews matched to the product. See Review apps and CSV import.
How Nexus works
Nexus builds the page from your store, order, analytics and review data. Fixed rules calculate the scores, chips, stickiness verdict and Key Insights. Top 3 Actions show the findings Nexus has for the product. AI writes the jobs to be done and part of the creative briefs. The jobs depend on review sync. Orders and Customers depend on order data.
Open a product
- Click a row in Insights > Products > Product List. A window titled Product details opens. Click Back to close it.
- Click a product name on a page that links to it, such as Product Stickiness, or an ad in Create > Ads. The full page opens, with a breadcrumb back to Products.
Run the jobs to be done
INFO
Recompute and Extract JTBD do not use your credits, but limits apply.
If the product has no jobs yet, click Extract JTBD. Click Recompute to read the reviews again. For confidence and the Vitamin to Painkiller score, see JTBD Insights.
Use the data tables
Use the switcher at the bottom to change tables. Orders and Customers load when you open them.
Exact output
The header
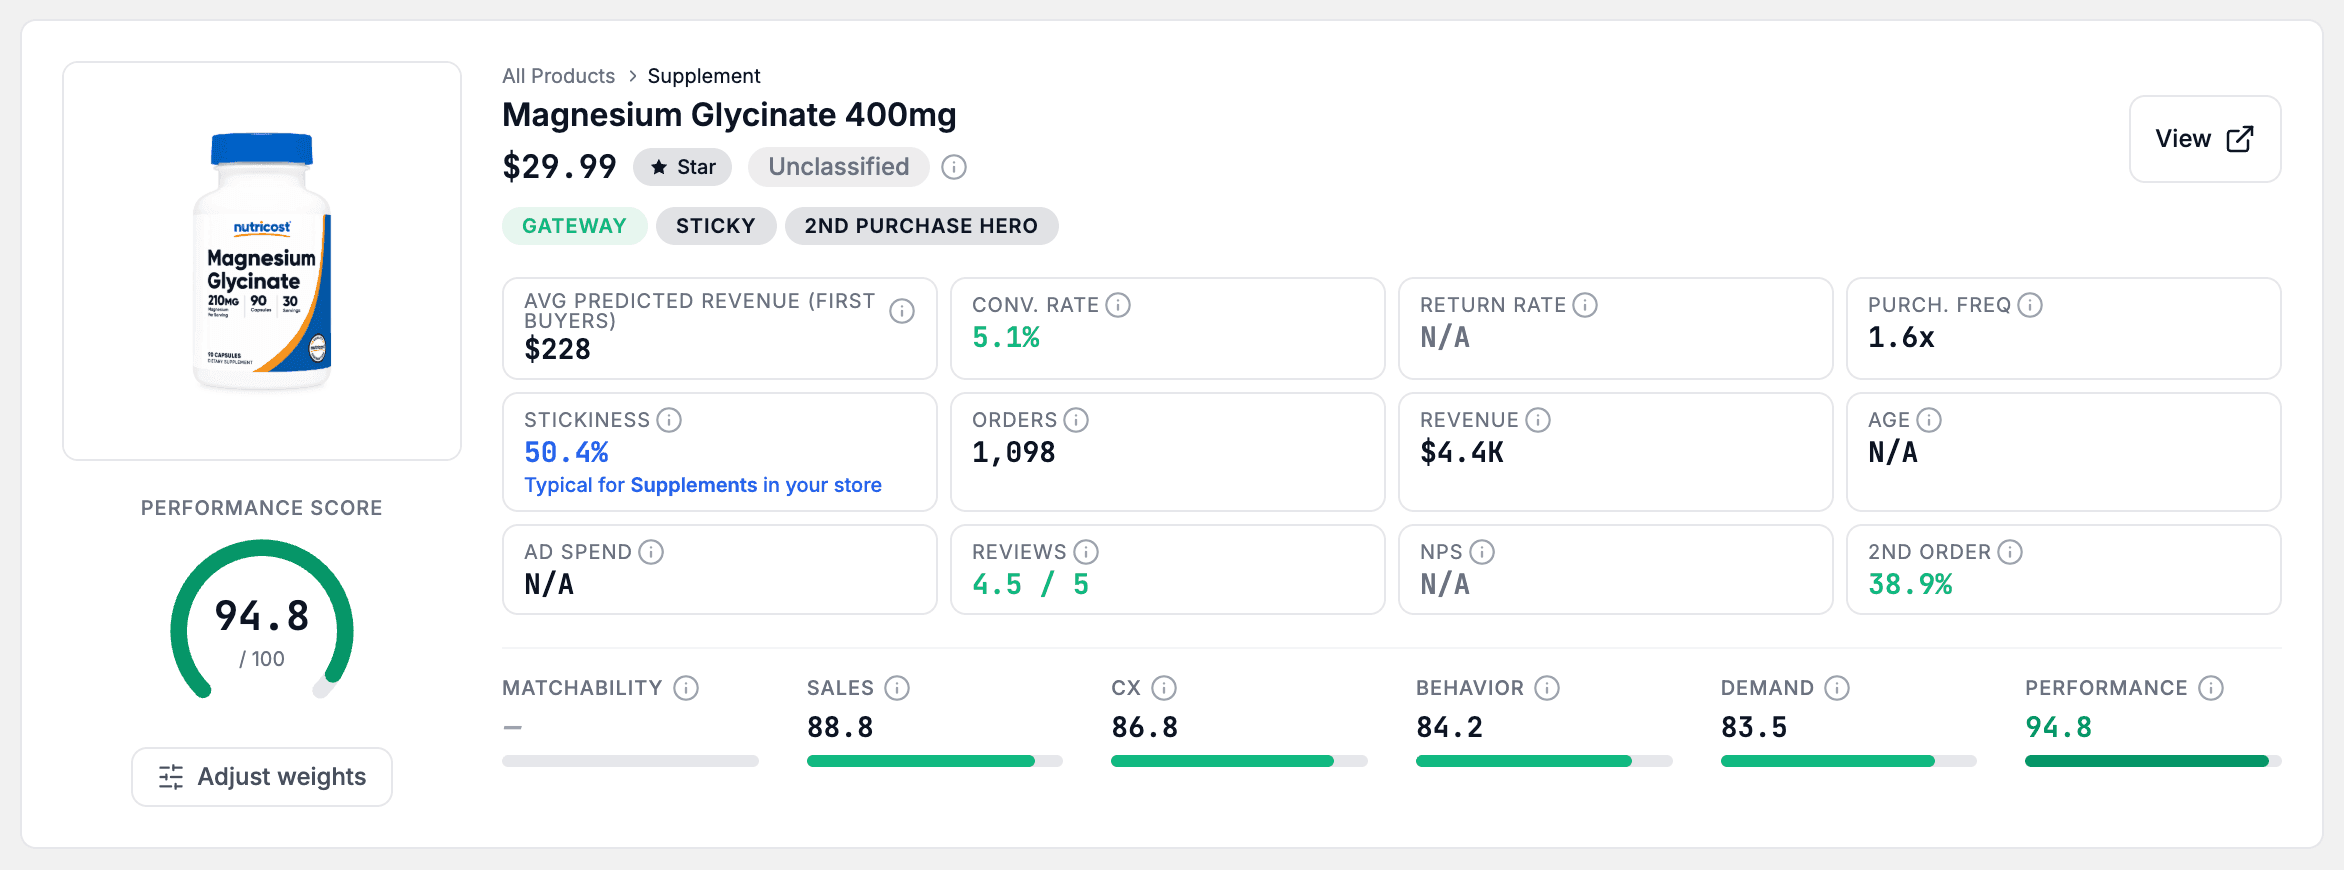
The header shows the product image, its Performance Score out of 100, its name, its price and a quadrant pill such as Star. A GA4 tier badge such as Best sits beside the pill. Click its info icon for all five tiers. View opens the product on your storefront in a new tab.
Select the Performance Score gauge, or the Adjust weights button under it, to open Performance Score weights with this product in the preview.
A product with no Performance Score shows a dash and No score yet in the gauge. Nexus has not scored it yet, or had no order data for it in its latest scoring run. The gauge then opens nothing, and Adjust weights does not show. A product with no sales in the last 30 days shows a Not scored pill instead of a quadrant.
A chip shows under the name only when it is true. Hover over a chip for its meaning.
| Chip | Meaning |
|---|---|
| Gateway | Customers often buy this product first, then buy more. |
| Sticky | Customers come back to buy this product again. |
| 2nd Purchase Hero | Customers who buy it have a high chance of a second order. |
The metric tiles
Hover over a tile for its definition.
| Tile | What it shows |
|---|---|
| Avg predicted revenue (first buyers) | Estimated lifetime revenue, not profit, of customers whose first order had this product |
| Conv. Rate | Share of product views that end in a purchase (GA4) |
| Return Rate | Share of order lines for this product that were returned. Lower is better. |
| Purch. Freq | How many times a customer buys this product again, on average |
| Stickiness | Of the customers who first bought this product in the last 12 months, the share who bought it again in a separate order. A verdict sits below it (see below). |
| Orders | Delivered orders where the customer paid for this product. It covers the same period as Orders in Product List. |
| Revenue | Net revenue for the product, after refunds. It covers the same period as Revenue in Product List. |
| Reviews, NPS | Average star rating out of 5, and a product-level NPS from 0 to 10 |
| 2nd Order | Chance that a customer places a second order after buying this |
The Orders tile leaves out free-gift orders. A note such as "+12 free-gift orders not counted" says how many, so the tile can sit below the order count in Shopify.
The Stickiness verdict is one of Above typical, Above typical · small sample, Typical, Below typical or Not enough data. It names the group of similar products it compares against, for example "Below typical for Robes in your store". The Sticky chip uses a fixed bar, but the tile compares against similar products, so the two can disagree.
Below the tiles, bars show Sales, CX, Behavior, Demand and Performance, each from 0 to 100. Click a bar's info icon to see what raises or lowers it. A CX, Behavior or Demand bar shows Not counted when your weights set that group to 0%, or when this product has no data for any signal you weighted in it. See Product scores.
Actions, Key Insights and Jobs to be Done
A switcher below the header offers three views.
Top 3 Actions lists the three highest-priority findings for this product. When there are more than three, a link such as See all 5 actions jumps to the Actions table. An action about a campaign has a Create campaign button. It opens Performance > Campaigns. The findings are the same ones that Top findings shows. A finding you dismiss there no longer shows here.
Key Insights gives up to three short notes. They cover the product's quadrant, listing quality, return rate, job positioning, gateway status and an alert for a product that sells well but has a poor CX score. The quadrant note shows only for a product with a quadrant and a Performance Score.
Jobs to be Done shows the jobs customers hire this product for, decoded from reviews. It shows the number of jobs, such as "3 jobs identified", a Vitamin to Painkiller bar and Progress Desired. Each job card is Primary or Secondary, with a Confidence label and its Struggles. Nexus shows three cards. Click Show all to see every job. Alternatives Mentioned lists alternatives customers name.
Creative Briefs and Creatives
Creative Briefs counts the briefs for the product, such as "2 briefs available". Click a brief to expand it. It shows an urgency tag, the platform and format, the reason (Why), the Angle, the Hook, the Duration, the Offer/CTA and Suggested Hooks. Click Generate creative to open the Creative Wizard with this product selected. See Generate a creative batch.
Creatives shows the images and videos linked to this product. Files you upload there go to your Library and stay linked here.
The data tables
| Table | Columns |
|---|---|
| Actions | Action, Type, Priority, Status, Est. Impact |
| Ads | Campaign, Platform, Status, Spend, ROAS, Impressions, Clicks, CTR |
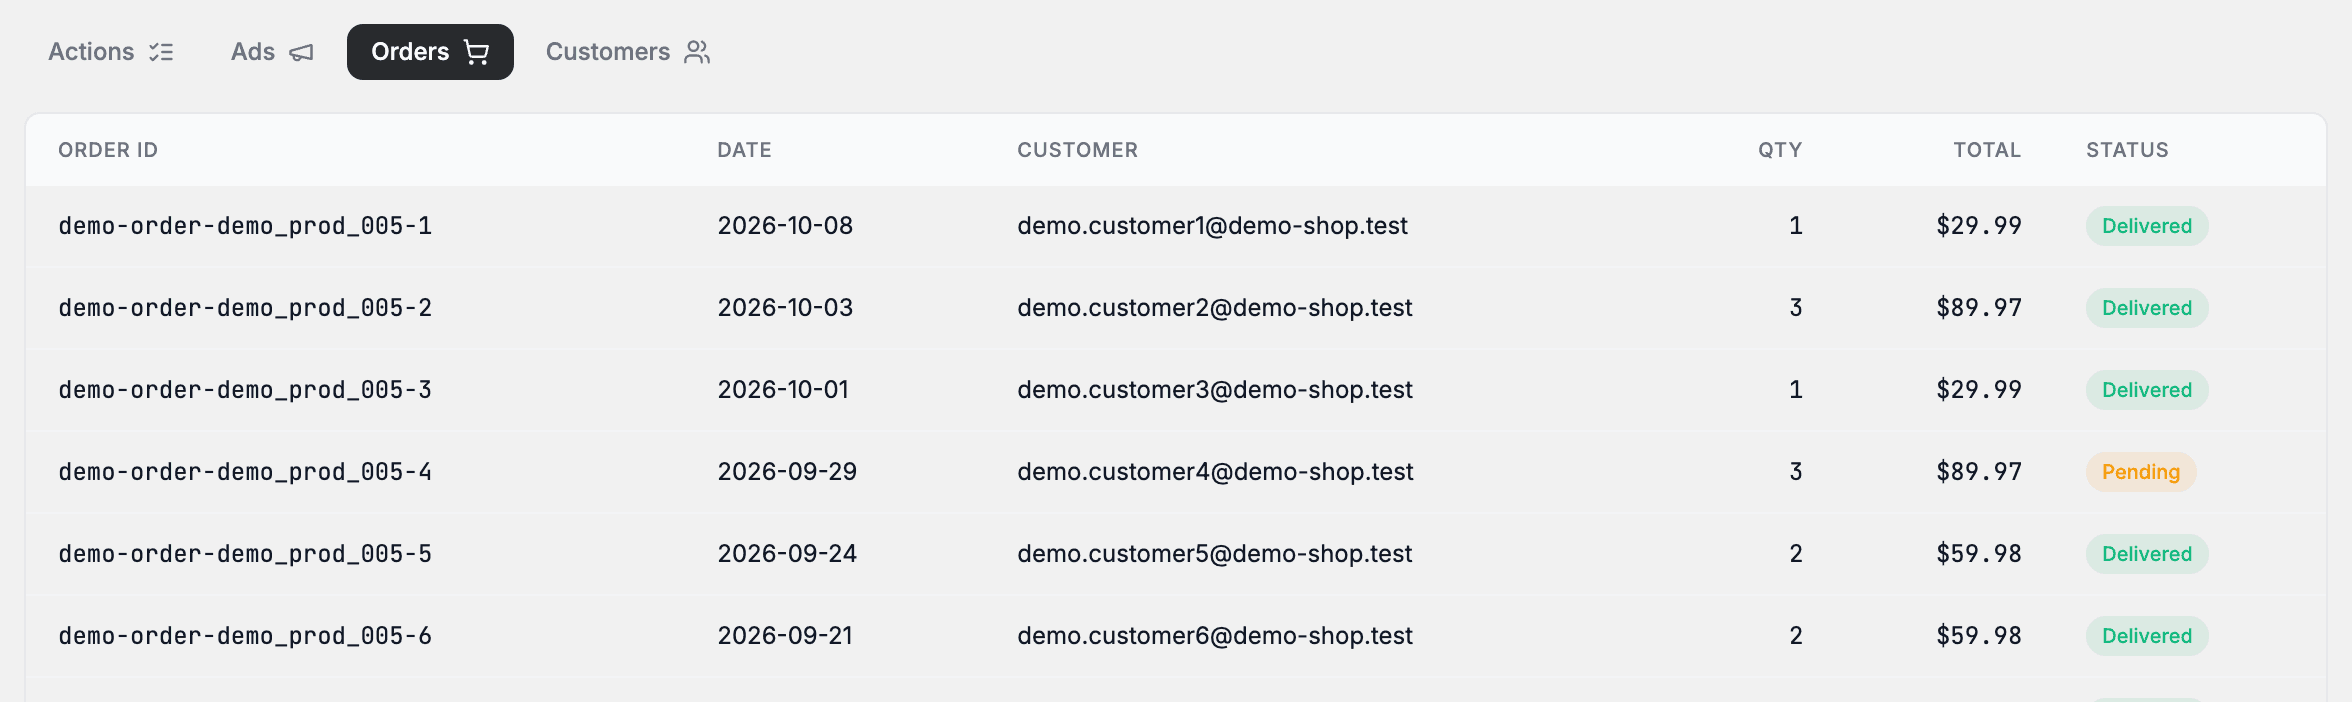
| Orders | Order ID, Date, Customer, Qty, Total, Status |
| Customers | Customer, Segment, Orders, Total Spent, Predicted revenue, Last Purchase |
Actions lists the product's findings, highest priority first. Ads lists only ads that Nexus made for the product, not every ad in your ad accounts. A Gift badge in Orders marks a free-gift line. Figures in Ads read zero until an ad has results, so a zero there does not mean a measured zero.
Set creative references
The card Set Creative References sits under the product image. Creative references are the product photos Nexus uses to generate ads. The card shows three thumbnails: Identity, Scale and Cut-out. Click one to open a window on that reference. Click Manual to choose the references yourself. Click Auto to let AI pick them. Auto fills only the references that are empty. While Nexus updates the references, the controls pause and the card reads "Creative references are being updated. Changes are paused until that finishes."
What to do with it
| What you see | Decision or action | Owner |
|---|---|---|
| A low Performance Score or score bar | Read the bar's info icon, then fix the listing or price in Shopify admin. | ecommerce manager |
| A Performance Score built on signals your store does not use | Select the gauge or Adjust weights under it, and change the weights in Performance Score weights. | ecommerce manager |
| A high Return Rate | Check the product page and quality with your supplier, outside Nexus. | ecommerce manager |
| A Gateway chip | Lead with the product in ads for new customers. You run the ads outside Nexus, in Meta Ads Manager or Google Ads. | media buyer |
| A Sticky or 2nd Purchase Hero chip | Feature the product in repeat-purchase campaigns. You send them from your email tool, outside Nexus. | retention marketer (the person who runs email and repeat-purchase campaigns) |
| Top 3 Actions and Actions | Work through the findings by priority. See Work through findings. | ecommerce manager |
| Create campaign | Click it to open Performance > Campaigns. | media buyer |
| A brief's Angle and Hook | Pick the message for the next ad. Click Generate creative. | creative strategist |
Expected value and measurement
This page can help you find the reason behind a product's score in one place. To check an action, note a tile such as Return Rate, Conv. Rate or Stickiness now and compare it later. For ads, open Performance > Ad performance, select By product and compare two equal date ranges. A price change or sale in the same weeks hides the effect.
Limitations and exceptions
- Avg predicted revenue (first buyers) and 2nd Order are estimates.
- AI writes the jobs to be done and part of the creative briefs. They can be wrong.
When data is missing
| What you see | What to do |
|---|---|
| Failed to load product details. | The product may not be in your store. Click Go back, or Back to Products if you opened the product from a link. |
| N/A or a dash on a tile | Nexus has no data. It does not mean zero. |
| No score yet on a bar or in the gauge | Nexus has no data for that score. CX needs reviews matched to the product. Sales, Behavior, Demand and Performance need order data from the latest scoring run. The bar or gauge fills once Nexus scores the product. Until then the gauge opens nothing. |
| Not scored instead of a quadrant | The product had no sales in the last 30 days, so it has no quadrant. Key Insights and the actions then say nothing about a quadrant. |
| Not counted on a bar | Performance leaves that group out: your weights set it to 0%, or this product has no data for any signal you weighted in it. To count a group at 0% again, raise its weights in Performance Score weights. |
| Not enough data in Stickiness | The product has too few customers for a verdict, or Nexus has no repeat-purchase data for it yet. Treat the verdict as unknown. |
| "Suggested actions — product insights haven’t been computed for this product yet." | Read the suggestions. They come from the product's numbers. |
| No briefs yet. | Click Generate creative. |
| No ad campaigns yet, No orders yet or No customers yet | The table has no rows for this product. |
| Couldn’t load orders — please try again. or Couldn’t load customers — please try again. | Try again. |
| No JTBD data available for this product. | Click Extract JTBD. |
In Demo Mode
Recompute and Extract JTBD do not start a job. The Set Creative References card does not show.